Ok, this was triggered by a Politico article (I know, Politico), which included this throwaway line, “The economy has largely recovered.” The conclusion to be drawn is that a lousy economy can’t have anything to do with young people loving Bernie.
Wrong.
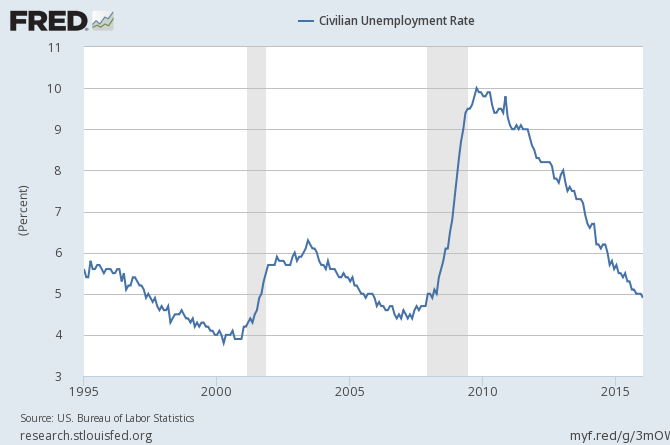
Here’s the thing: People take the unemployment rate as meaning something to ordinary people, though it almost never does. Here’s the unemployment rate chart:

Unemployment Rate to Dec 2015
Now, looking at that you could be forgiven for thinking, “Ian, the economy really has largely recovered. Are you on crack?”
No Sir, I am not on crack. I am too poor to afford crack.
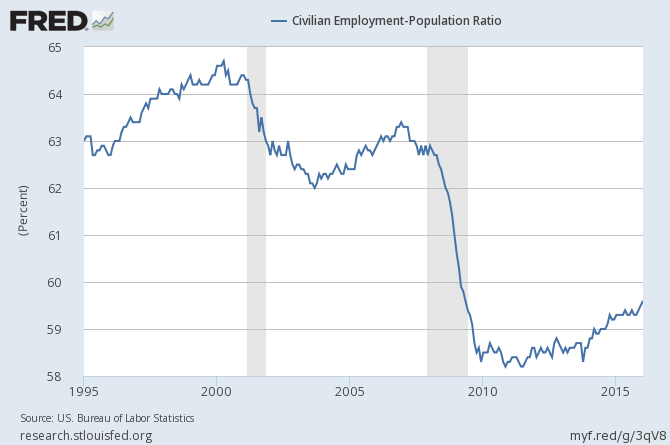
Here is the ratio of employed people to the population:

Employment Ratio to Dec 2015
Oh.
There has been no meaningful recovery in the actual percentage of Americans employed. The jobs do not exist. The unemployment rate is what it is because people have stopped looking, and what the unemployment rate measures is the percentage of people who are actively looking for a job, as compared to the people who are employed (the labor force).
(I am fundraising to determine how much I’ll write this year. If you value my writing, and want more of it, please consider donating.)
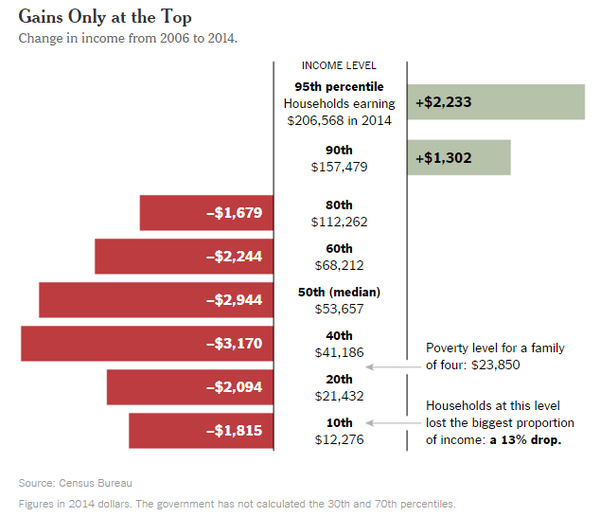
Now here’s a nifty graphic from the New York Times to round out the picture. Less people are working, as a percentage of the population, AND those who are working are earning less money:
The economy sucks. If you aren’t in the top 10 percent, it never recovered. It didn’t mostly recover, it mostly didn’t recover.
I will discuss what unemployment really measures in a later article. It doesn’t measure…unemployment.


Lee Doran
Hi Ian,
And many thanks as ever. These are amazing graphs which TELL ALL!
I am sorry to have to tell you that I am simply not able to support your fundraising campaign again this year. Prospects are much more positive than last year at this time but head barely above water does not mean able to help you out — as much as I would like to (and as much as you clearly deserve).
So my apologies once again … but I also send my deep appreciation for the wisdom and insight and understanding you share with me at least at no cost … so generously. Thank you for that!
I’m feeling very spring-like these days as the world burns up (our 2 days of winter for the year now being in progress) … I would still love to get together in person if you are in TO and available and interested. As I turn 72 tomorrow, I find the remaining years’ getting down to single digits quite interesting… hahaha.. and mind-focusing too (!)
all best regards and thanks again,
L.
John Poynton
Too right, Ian. Similarly in the UK we have George Osborne talking about complacency over the ‘recovery’ and warning there were ‘international threats’ ahead! Guess he is just starting on his excuses.
Your graph confirms my own for the UK and that immigration is largely responsible for the decline per capita. I understand the US has very similarly problems from Mexico as the UK does from the EU. At least we can get out of the EU (in theory – I’ll believe it when it happens!). Perhaps you can ‘Trump’ that? (sorry!)
You may like my post at https://jepoynton.com/2015/07/29/the-july-2015-budget-what-osborne-got-right-what-he-got-wrong-and-what-he-should-have-done-but-didnt.
Lee
While I tend to agree that the recovery has been non-existent for most people, I do wonder about the employment ratio graph. While it looks very dramatic, what exactly does a 3% drop mean? Unfortunately, I don’t know that 3% is significant enough for the elite to concern themselves with.
reslez
3% is a massive, generational change that represents millions of households. It’s erasing gains that happened when women entered the workforce in the 70s and 80s. We know that wages are not rising to make up for the loss of that income, in fact they have shrunk. And keep in mind workforce particpation depends on the definition — some of those people supposedly in the workforce may be holding down a patchwork of part time jobs or scraping together a few hours in the gig economy here and there.
Sent my donation yesterday
Joe marchal
The Media echo attempts to convince one it’s only you that remain mired in some poverty stricken black hole. This recovery story is a perfect example of weaponizing the media. The implication here is obviously that one is a looser because every body else is getting rich. One’s poverty is clearly due to some personal merit based issue. I have lived in the area since 1978. I have ridden by my bike all over the pot holed roads and by the paint peeled rotting victorians. While real estate costs have become insane many empty warehouses and commercial buildings have remained unused displaying large “for lease” signs. The booming bay area has more urine soaked alleys than ever, more garbage blowing in the streets and more desperate homeless and clearly mentally ill and just down on their luck. They can be seen everywhere wandering the streets and living in the margins. How’s that for the great myth of booming economy? You don’t need to look at graphs, just look around. Folks just don’t get out much if they still believe in some recovery for normal people that they’re not a part of.
Tim
This chart echos the similar “Labor Participation Rate” chart available through the BLS. Basically, it has been more or less dropping since the year 2000. The view, somewhat popular among technologists and forward thinkers, and somewhat poo-poo’d by traditional economists and policy makers, is that the jobs will never return due to increasingly sophisticated software and robotics automating away the labor force. We need to prepare for a job sparse economy, and increase individual resilience & self-sufficiency in that sort of world. Unfortunately the leadership is focused on tweaking tax rates (up or down, depending on the political leaning) interest rates and other levers to push us back in time to the relative full employment of the 1990’s. Anyway, great posting.
Hugh
Each September the Census puts out a publication on household income for the preceding year. I generate graphs from its tables. Basically, what I have found is that there is a split between the top 20 percent and the bottom 80%. Since 1967 when the data start, real income among the top 20 % grew steadily to 1999 and robustly for the top 5%. The 60%-80%cohort saw moderate gains to 1999. The bottom 60% saw little or nothing. Since 1999, the bottom 80% have seen moderate income losses while the top 5% and 20% have shown volatility within an overall post-1999 plateau.
Importantly, the share of household income peaked for the bottom 80% in 1968 at 57.4%and has gradually and steadily been eroding ever since. In 2014, the top 20% had a majority share of household income of 51.2%
I should point out that income does not equal wealth. For wealth you need disposable income, something beyond making ends meet. The top 20% have and have a lot more disposable income. As a result, the wealth effect of the top 20% is much larger than that of the bottom 80%.
With regard to the participation rate, we need to take into account the effect of Baby Boomer retirements. I calculate that to January 2016, Boomer retirements have depressed the participation rate 1.72%. If you take the 67% participation rates of the Clinton expansion of the 1990s as at or near the top, then the current adjusted ideal participation rate would be 65.28%. I use this number in part to calculate what the real unemployment rate is. It hovers around 9% although it did spike in January due to the Christmas shopping season dropoffs to 9.5%.
I should add that I am not disagreeing with Ian. Just adding some further data points.
Hugh
Tim, it’s called jobs/skills mismatches and most economists and policymakers buy into the argument. It’s bunkum for the following reasons.
1) Job/skills mismatches should occur in certain selected sectors but we have seen job losses across the board.
2) If employers want skilled workers, they can offer higher salaries to attract and retain them. They can also train them and then pay to retain them. Millions of jobs weren’t sent to China because Chinese peasants fresh off the farm had special skill sets that American workers lacked but because they were cheap and could be abused.
3) Robotics and automation are just riffs on these. You can build a factory full of robots as easily, probably a lot more easily in North Carolina or Illinois or California than in China and reduce all your transportation costs and supply lines while improving your quality control and managerial oversight. So why are they being built in China? because it is not about automation but cheap labor.
Some Guy
Factor in part time vs. full time, job conditions, etc. and the picture just gets bleaker.
Hugh – thanks for the additional numbers, I come ti similar conclusions. Canada has similar demographics to the U.S. so that is another potential approach to the numbers (comparing U.S. participation rates to Canadian ones – not to say that Canada is at full employment, but it shows what should be possible in the U.S.).
Cujo359
Hugh writes:
On what basis? Thanks to the crash of 2008, I think it would be tough to make such a prediction. Lots of Boomer retirements became sabbaticals when 401Ks and other investments went south. I\’ve also noted that the EPOP for the 55-64 age bracket is roughly what it was in 2008,which suggests that older people really aren\’t retiring early.
I\’m not disagreeing so much as being skeptical.
Ian Welsh
Hugh,
one would think that Boomer retirements would make that difference, it makes sense. But the data I have seen is that the decline in labor force participation is coming from younger people. If so, that’s particularly devastating.
https://twitter.com/RudyHavenstein/status/697175756519010304
Cujo359
Wow, Ian, that’s even worse than I thought it was.
I’m part of the 55 and older crowd, and I can tell you that none of the people I know who are my age thinks this is a good economy to retire in. Most of us assume that we’ll be working until we drop over.
Needless to say, if you’re a twenty-something looking for work right now, that’s terrible news. Either we need to grow the economy a lot faster, or we need to pay Social Security recipients enough that they can live on it, because anything we oldsters invested for retirement is likely to go away.